Our Motivation
Shocks to the system have exposed the fragility of the U.S. supply chain, threatening the timely transport of goods and people, economic prosperity, equity, human health, national security, and the environment.
Accessibility to Goods
- The last mile represents 41% of the total supply chain cost in shipping10
- Delayed deliveries, rising prices, critical shortages of essential goods, lack of transportation means in disadvantaged communities
Heavy Carbon Footprint
- Transportation is the biggest contributor to climate change in the U.S., making up 27% of its planet-warming emissions in 20207
Broader Impacts
Addressing supply chain challenges
To address today’s supply chain challenges, a mobility system must be designed and implemented that is clean, secure, affordable, and equitable and provides sustainable transportation options for people and goods.

Food Insecurity
- Virginia’s food insecurity rate is 10.6%, not far off from the national average of 10.5%.
- Southwest Virginia Region has the highest food security and lowest socioeconomic status in Virginia.
- Tennessee falls above the 11.5% national average with a 14% food insecurity rate—a statistic that places Tennessee among the top 10 states with highest food insecurity in the nation.
- Across the three grand divisions of the state, more parents in east (45%) and west (44%) Tennessee reported low or very low food security than parents in middle Tennessee (38%).
- 1 in 6 children in North Carolina experience food insecurity.
- North Carolina had the 12th highest rate of child food insecurity in the U.S. in 2020, and has since fallen to 9th in the nation.

Digital Literacy
- Of the 25 million Americans without broadband access, 19 million live in rural areas. 58% of adults in rural areas have a high-speed broadband connection at home, as opposed to 67% in urban areas and 70% in suburban areas.
- The gap exists in rural America because it’s not economically beneficial for internet service providers to lay fiber and provide broadband connections in many sparsely populated areas of the country. The return on investment simply isn’t there.
- At least 1.1 million North Carolina households lack access to high-speed internet, cannot afford it, or do not have the skills needed to take advantage of the digital economy.

Business Decline
- Brain drain goes hand in hand with population decline. Only 11% of U.S. counties lost population between 1970 and 2000; of these counties, 96% experienced brain drain and 95% were nonmetropolitan or rural.
- Many Appalachian counties are in the bottom 10% of the U.S. on economic indicators due to limited job prospects, low average hourly wages, low educational attainment, and low returns to education.
- Southwest Virginia has seen a 49% decrease in manufacturing employment, 68% decrease in mining employment, and 35% decrease in agriculture employment since the 1990s.
- In June 2021, Tennessee’s unemployment rate was one percentage point higher than before the pandemic and remained elevated in all but 2 of the state’s 95 counties. There were 40% fewer small businesses in Tennessee than before the pandemic.

Infrastructure
- Virginia earned a “C” grade in the 2021 Infrastructure Report Card. Across the Commonwealth, inflation, workforce struggles, and political gridlock threaten infrastructure stewardship.
- North Carolina faces infrastructure challenges of its own. For example, driving on roads in need of repair in North Carolina costs each driver $500 per year, and 9.3% of bridges are rated as structurally deficient.
- Infrastructure needs for Tennessee’s transportation and utilities increased for the seventh year in a row (by $750 million) and continues to be the largest category in the inventory, with $35.2 billion in total needs (56.1% of the inventory).
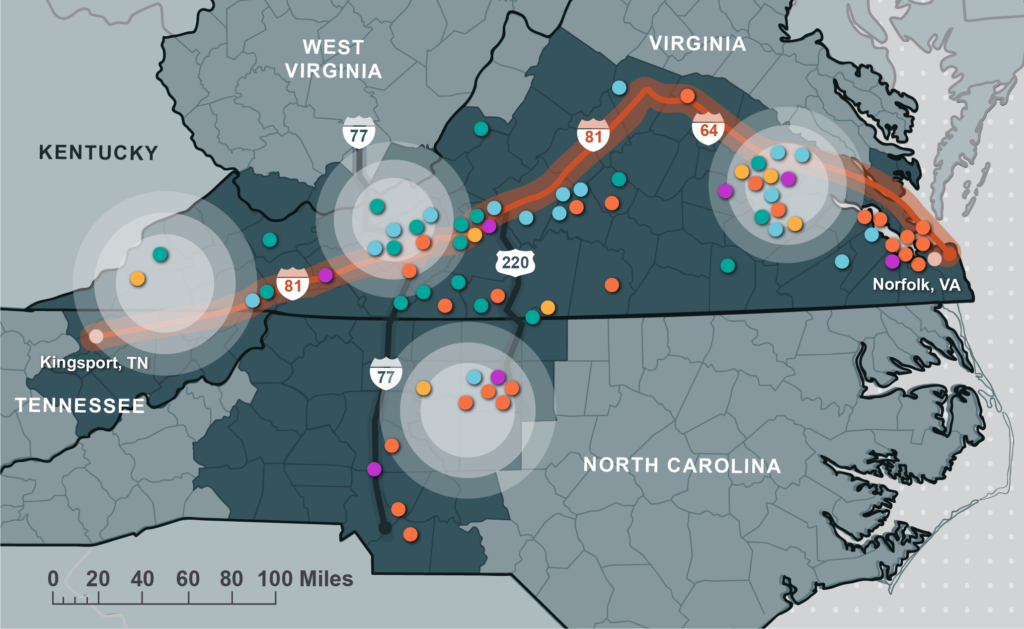
Regional Assets & Corridor

- Region
- Primary Innovation Corridor (via I-81 & I-64)
- Sample Implementation Hubs
- Advocacy, Industry, & Business Development
- Education & Workforce Development
- Logistics & Data
- Retail & Transportation
- Tech & Manufacturing


